Wall Street VS Main Street

What is the relation between the economy and the stock market?
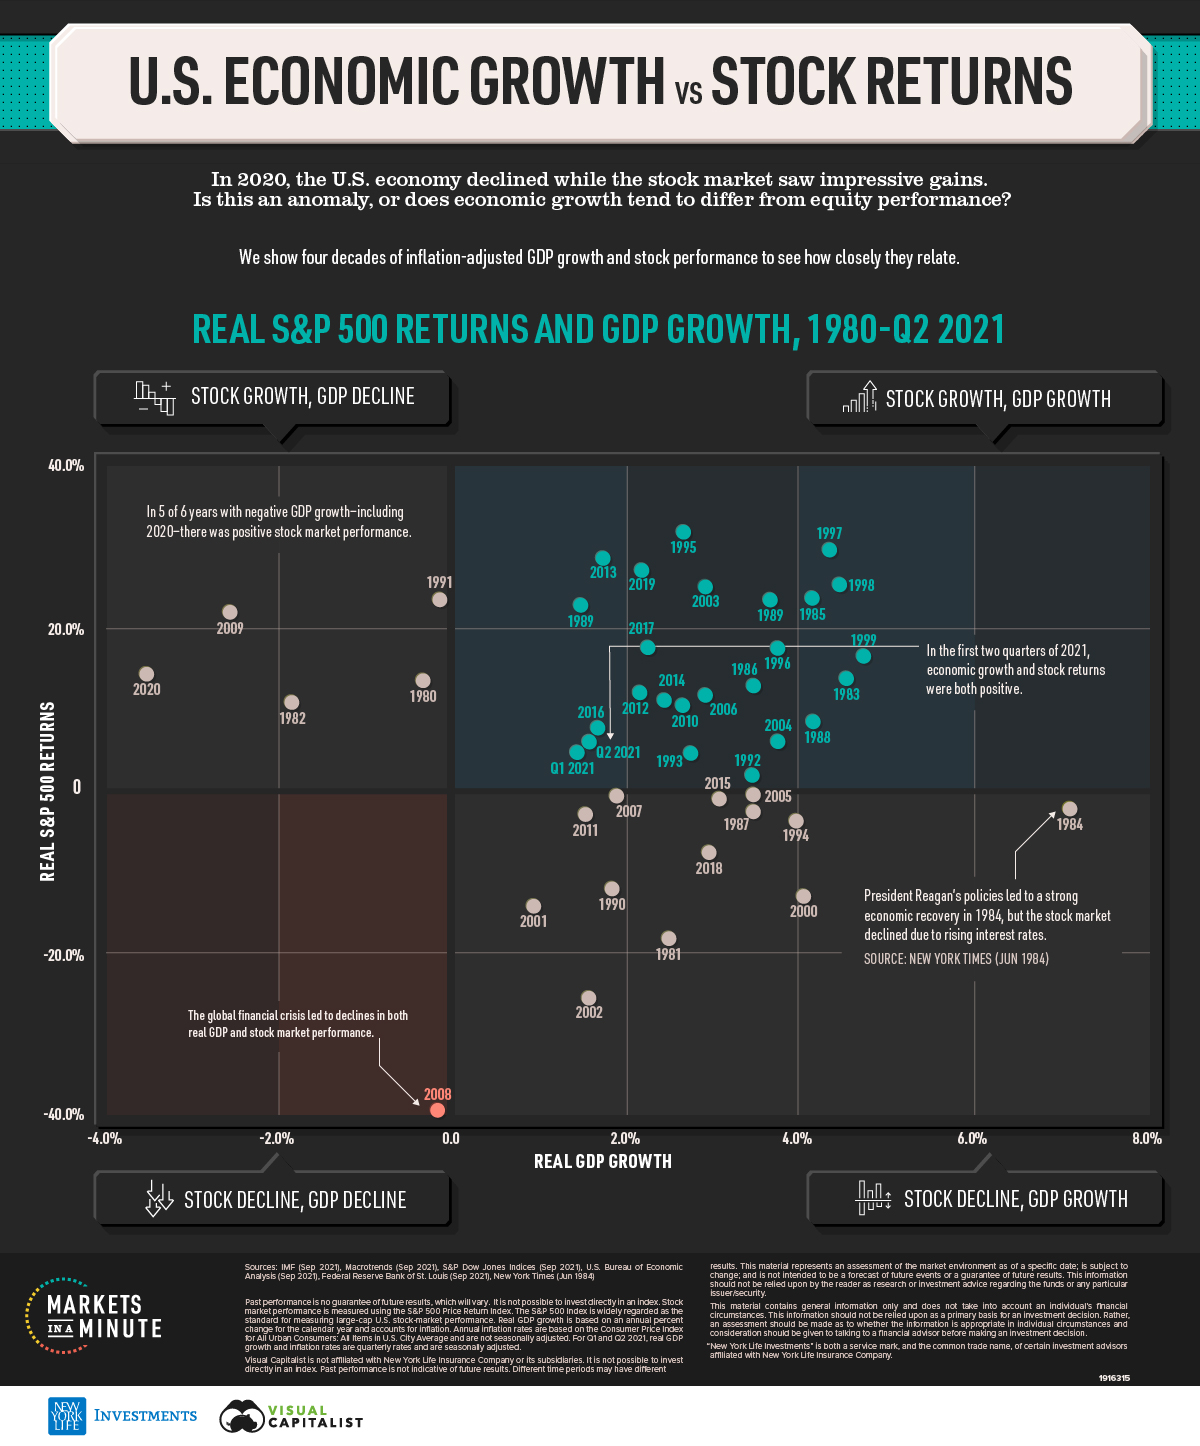
Here is a comparison between S&P 500 returns and U.S. GDP growth since 1980, revealing that the two have a very complicated relationship
In 2020, the stock market and the economy had a very public break up. The Wall Street vs Main Street divide—the gap between America’s financial markets and the economy—was growing. By the end of the year, the S&P 500 Index closed at a record high. In contrast, 20 million Americans remained unemployed, up from 2 million at the start of the year.
Was 2020 an outlier, or does the performance of the stock market typically diverge from the economy? In this Markets in a Minute chart from New York Life Investments, we show U.S. economic growth and stock market performance over the last four decades, to see how closely the two relate.
GDP Growth and S&P 500 Returns
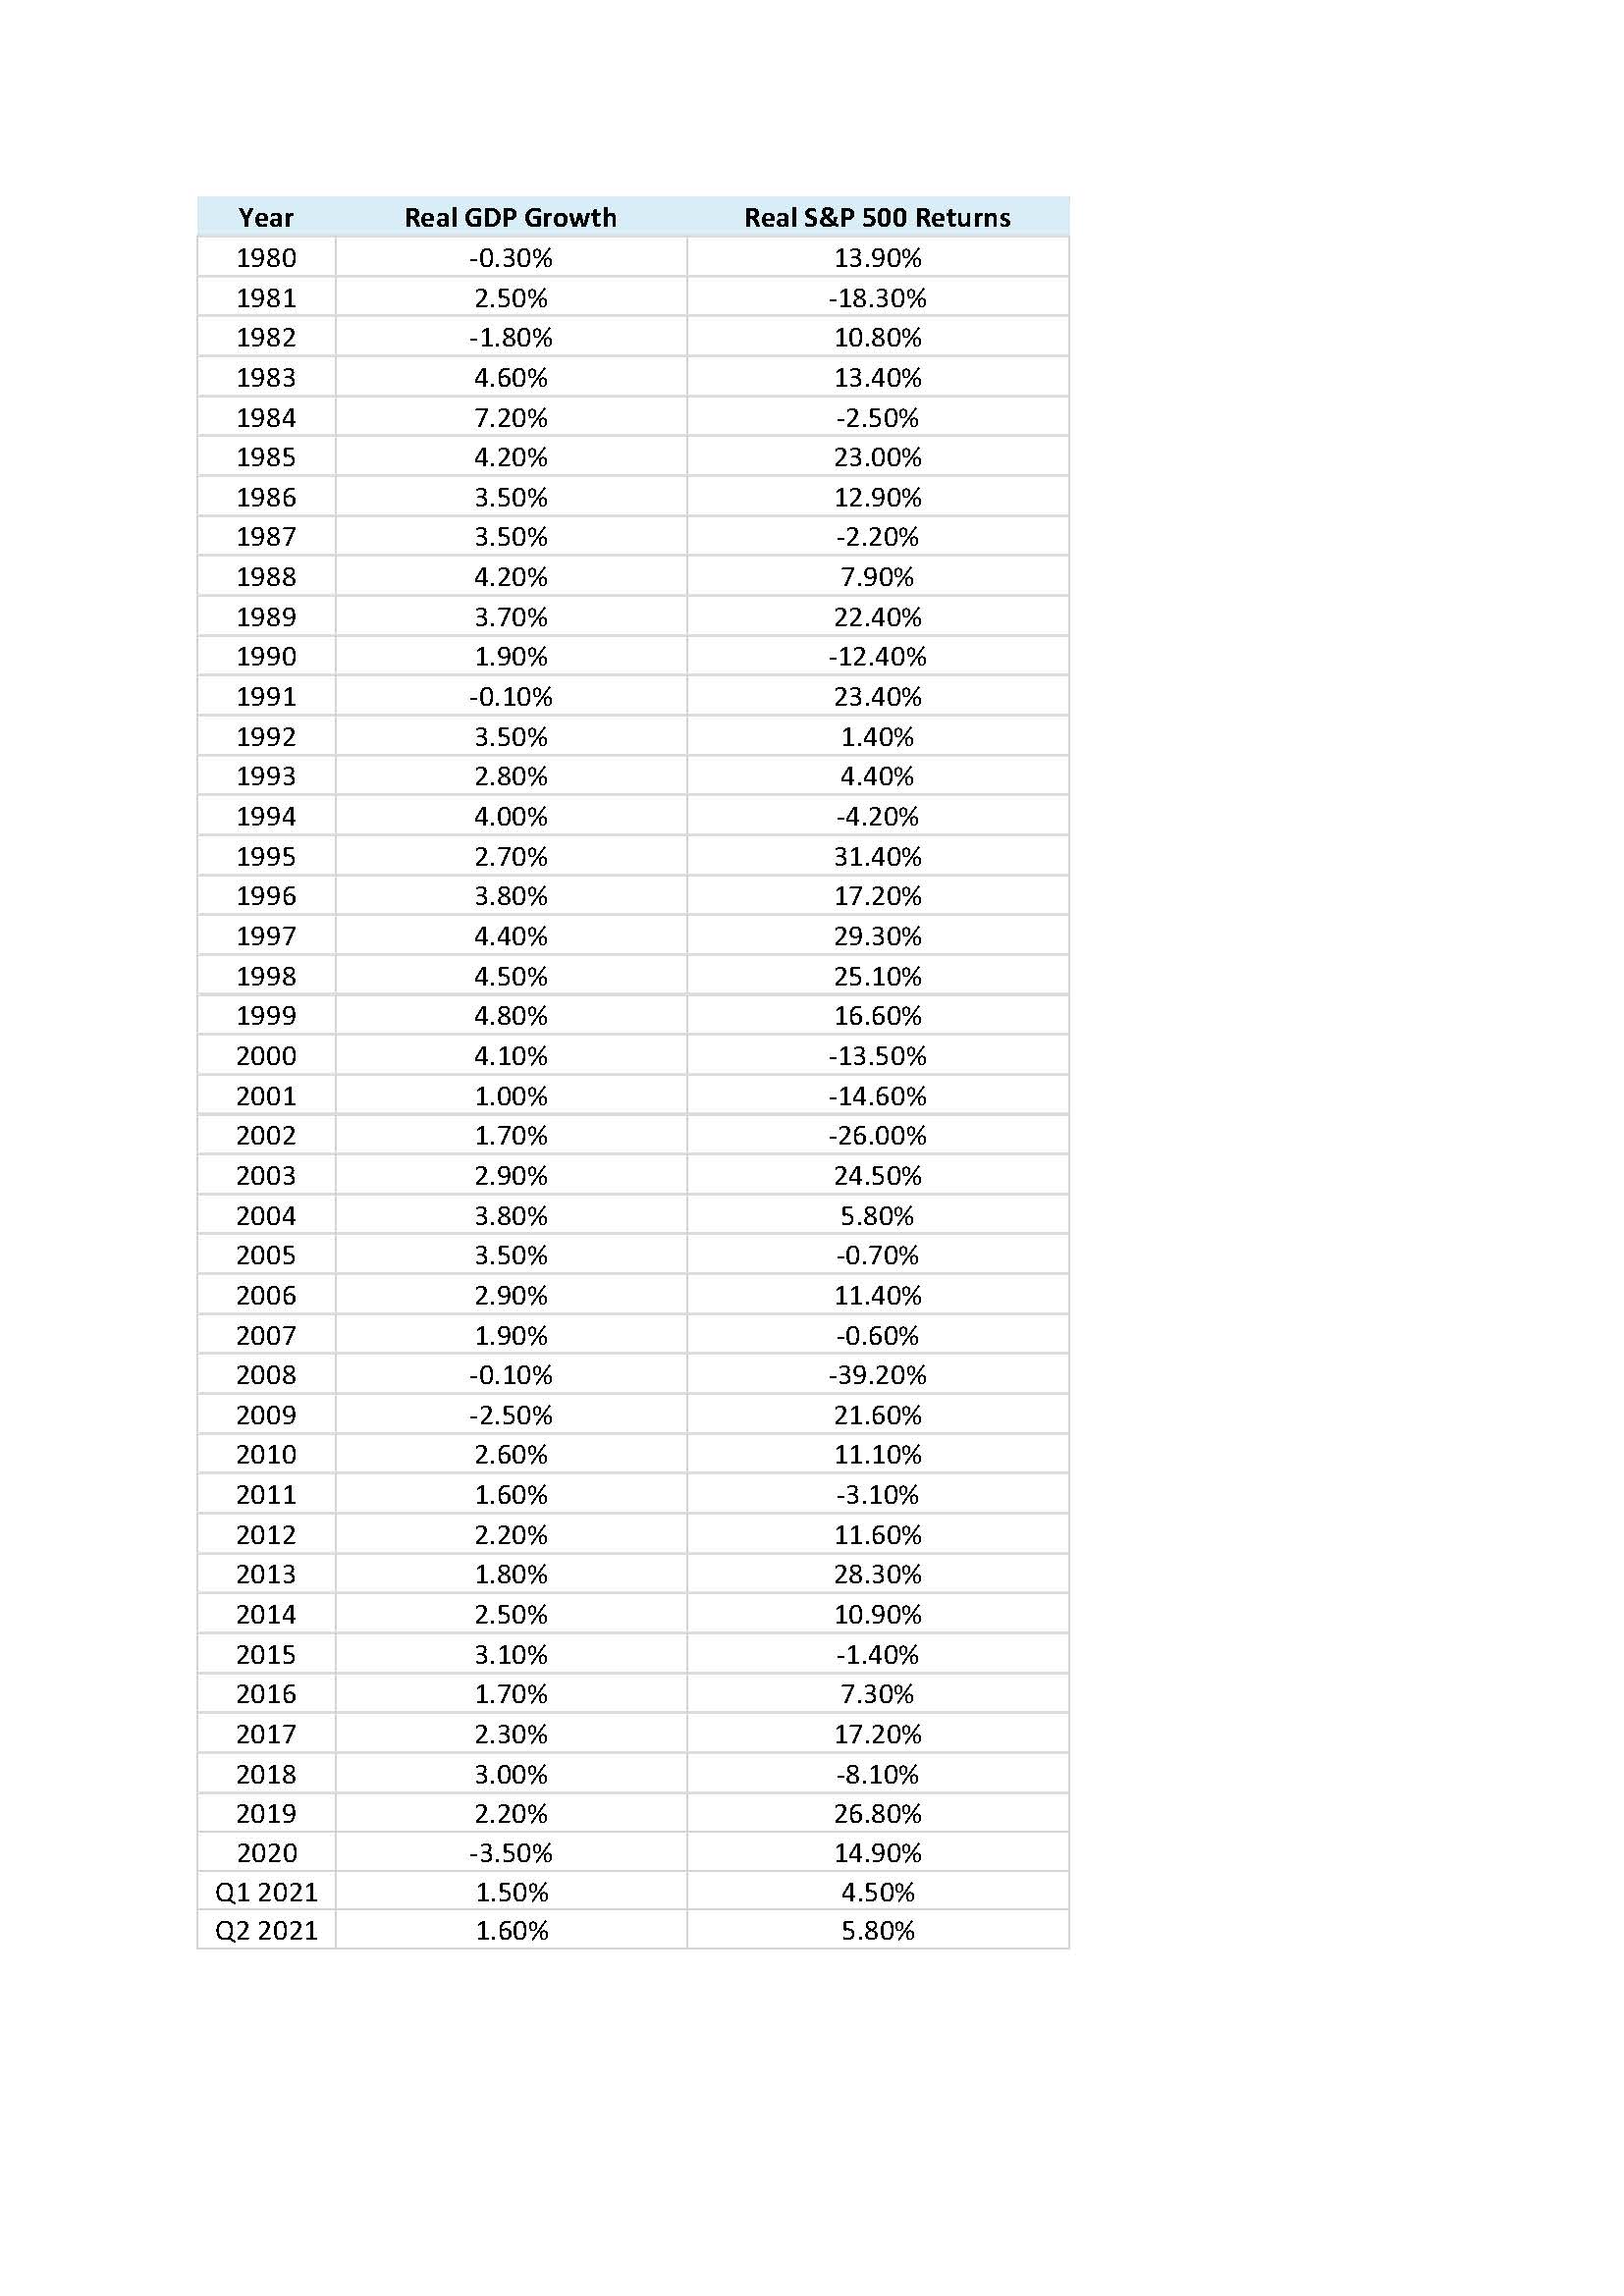
Here’s how annual GDP growth and S&P 500 Index returns stack up from 1980 to the second quarter of 2021. Both metrics are net of inflation.
More often than not, GDP growth and S&P 500 Index returns have both been positive. The late ‘90s saw particularly strong economic activity and stock performance. According to the White House, economic growth was bolstered by cutting the deficit, modernizing job training, and increasing exports. Meanwhile, increasing investor confidence and the growing tech bubble led to annual stock market returns that exceeded 20%.
In the selected timeframe, only 2008 saw a decline in both the stock market and the economy. This was, of course, caused by the economic growth was bolstered. Banks lent out subprime mortgages, or mortgages to people with impaired credit ratings. These mortgages were then pooled together and repackaged into investments such as mortgage-backed securities (MBS). When interest rates rose and home prices collapsed, this led to mortgage defaults and financial institution bankruptcies as many MBS investments became worthless.
Moving in Opposite Directions
What about when the Wall Street vs Main Street divide grows?
Historically, it has been more common to see positive GDP growth and negative stock performance. For example, real GDP grew by a whopping 7% in 1984 due to “Reaganomics”, such as tax cuts and anti-inflation monetary policy. However, the stock market declined as rising treasury yields of up to 14% made fixed income investments more attractive than equities.
On the other hand, in five of the six years with negative GDP growth, there have been positive stock returns. The most recent example of this is 2020. Real GDP declined by 3.5%, while the S&P 500 returned almost 15% net of inflation.
The Stock Market is not the Economy
There are a number of reasons why the stock market may not necessarily reflect what is happening in the economy.
- The stock market reflects long-term views. A stock’s price factors in what investors think a company will earn in the future. If investors are confident in the likelihood of an economic recovery, stock prices will likely rise. In contrast, GDP growth is a hard measure of current activity.
- Sector weightings in the stock market do not reflect their contributions to GDP. The stock market remained resilient in 2020 largely because technology, media, and telecom (TMT) stocks performed well. Despite making up 35% of the market cap of the largest 1,000 U.S. stocks, these companies only account for 8% of U.S. GDP. In contrast, hard-hit companies such as restaurants and gyms generate lots of jobs and contribute materially to GDP. However, many of these businesses accounted for a small portion of the stock market or are not even publicly listed.
- Fiscal policy lags behind monetary policy. The U.S. Federal Reserve (Fed) can act quickly. For instance, the Fed bought $1.7 trillion of Treasury securities between mid-March and June 2020 to stabilize financial markets. On the other hand, fiscal support requires legislative approvals. The U.S. government initially provided large-scale economic stimulus through the CARES Act in March 2020, but further relief packages were stalled due to political disagreements.
While many factors are at play, the above can help explain the Wall Street vs Main Street divide.
Wall Street vs Main Street: Together and Apart
Over the last 41 years, the economy and the stock market have moved in opposite directions almost as often as they have moved in the same direction. Here’s a summary of their movements from 1980-2020.
- Stock Growth, GDP Growth 22 years
- Stock Decline, GDP Growth 13 years
- Stock Growth, GDP Decline 5 years
- Stock Decline, GDP Decline 1 year
Since 1980, these time periods of differing performance have never lasted more than three consecutive years. In fact, one economist described the stock market and the unemployment rate as two people walking down the street, tethered by a rope.
”When the rope is slack, they move apart. But they can never get too far away from each other.”
—Roger Farmer, University of Warwick economist
After their public breakup in 2020, the Wall Street vs Main Street divide appears to have healed. In the first two quarters of 2021, both the stock market and the economy saw growth. Perhaps it’s easiest to sum up their relationship in two words: it’s complicated.
Source: The Advisor Channel https://advisor.visualcapitalist.com/wall-street-vs-main-street-the-stock-market-is-not-the-economy/